Meeting Analytics
The Meeting Analytics section allows you to check the meeting quality of every ongoing and every ended meeting. In this part, you can see the bitrate of the video, audio, and shared content, as well as the package loss, the jitter, the delay. With these data, you can generally estimate how the meeting quality is and what affects the quality.
Prerequisites
- An enterprise plan is required
- Admin access with relevant permission
Getting Started
- Sign in to the Matrx admin portal.
- In the navigation menu, unfold Meeting Management, click Ongoing orHistory.
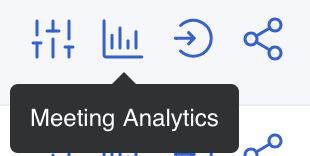
- In the action part, click the Meeting Analytics button
 to see the details of each meeting.
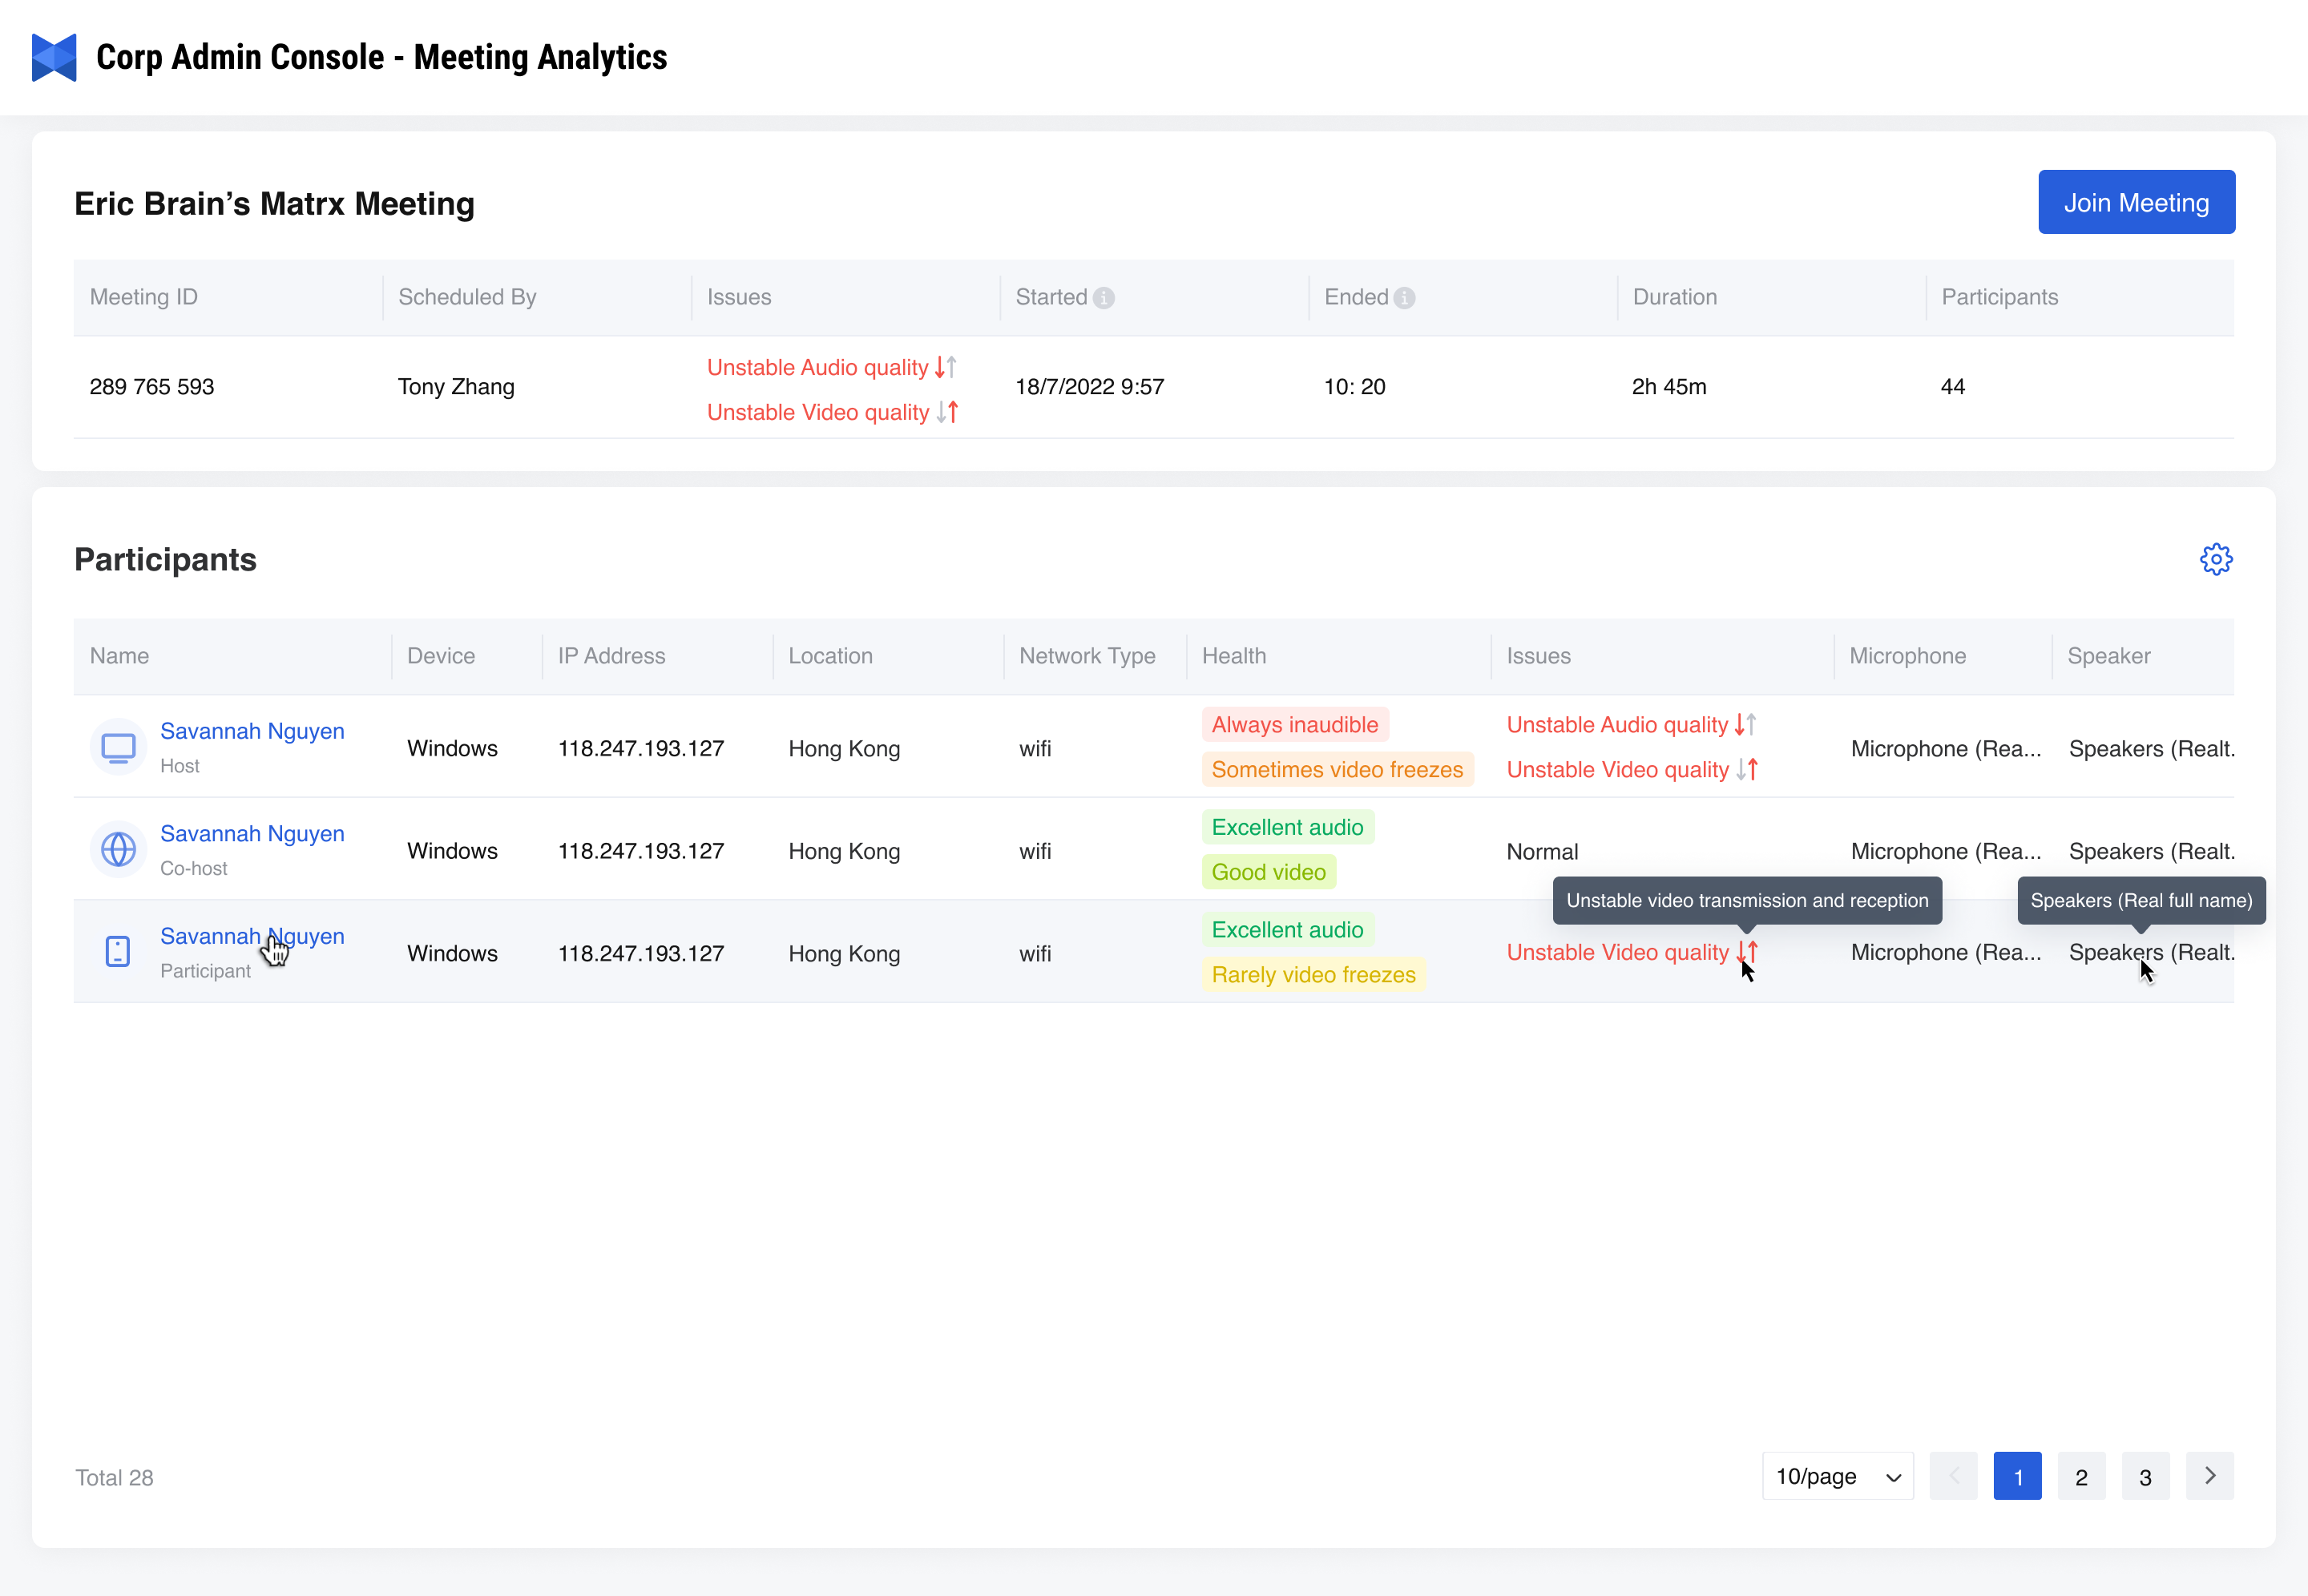
Participants Details
Click the Meeting Analytics icon, more details of participants in a meeting can be found. The following data can be found in the participant list:
- Participant: the member who joined the meeting.
- Device: the device participants used to join a meeting on Matrx.
- IP address: the address that participants connected when joining a meeting.
- Location: the location where the IP address is hosted.
- Network Type: the network type that participants used when joining a meeting. E.g. wifi
- Health: a summary of the meeting quality of every participant, such as Excellent audio and video, or Always inaudible and sometimes video freezes.
- Issue: all the connection problems that the participant may have during the meeting. E.g. Audio unstable, video unstable…
- Microphone: the microphone that was detected by Matrx client.
- Speaker: the speaker that was detected by Matrx client.
- Camera: the camera that was detected by Matrx client.
- Joined: the time that the participant joined the meeting.
- Left: the time that the participant left the meeting. The information mark beside "Left" shows the details of how the participant left the meeting.
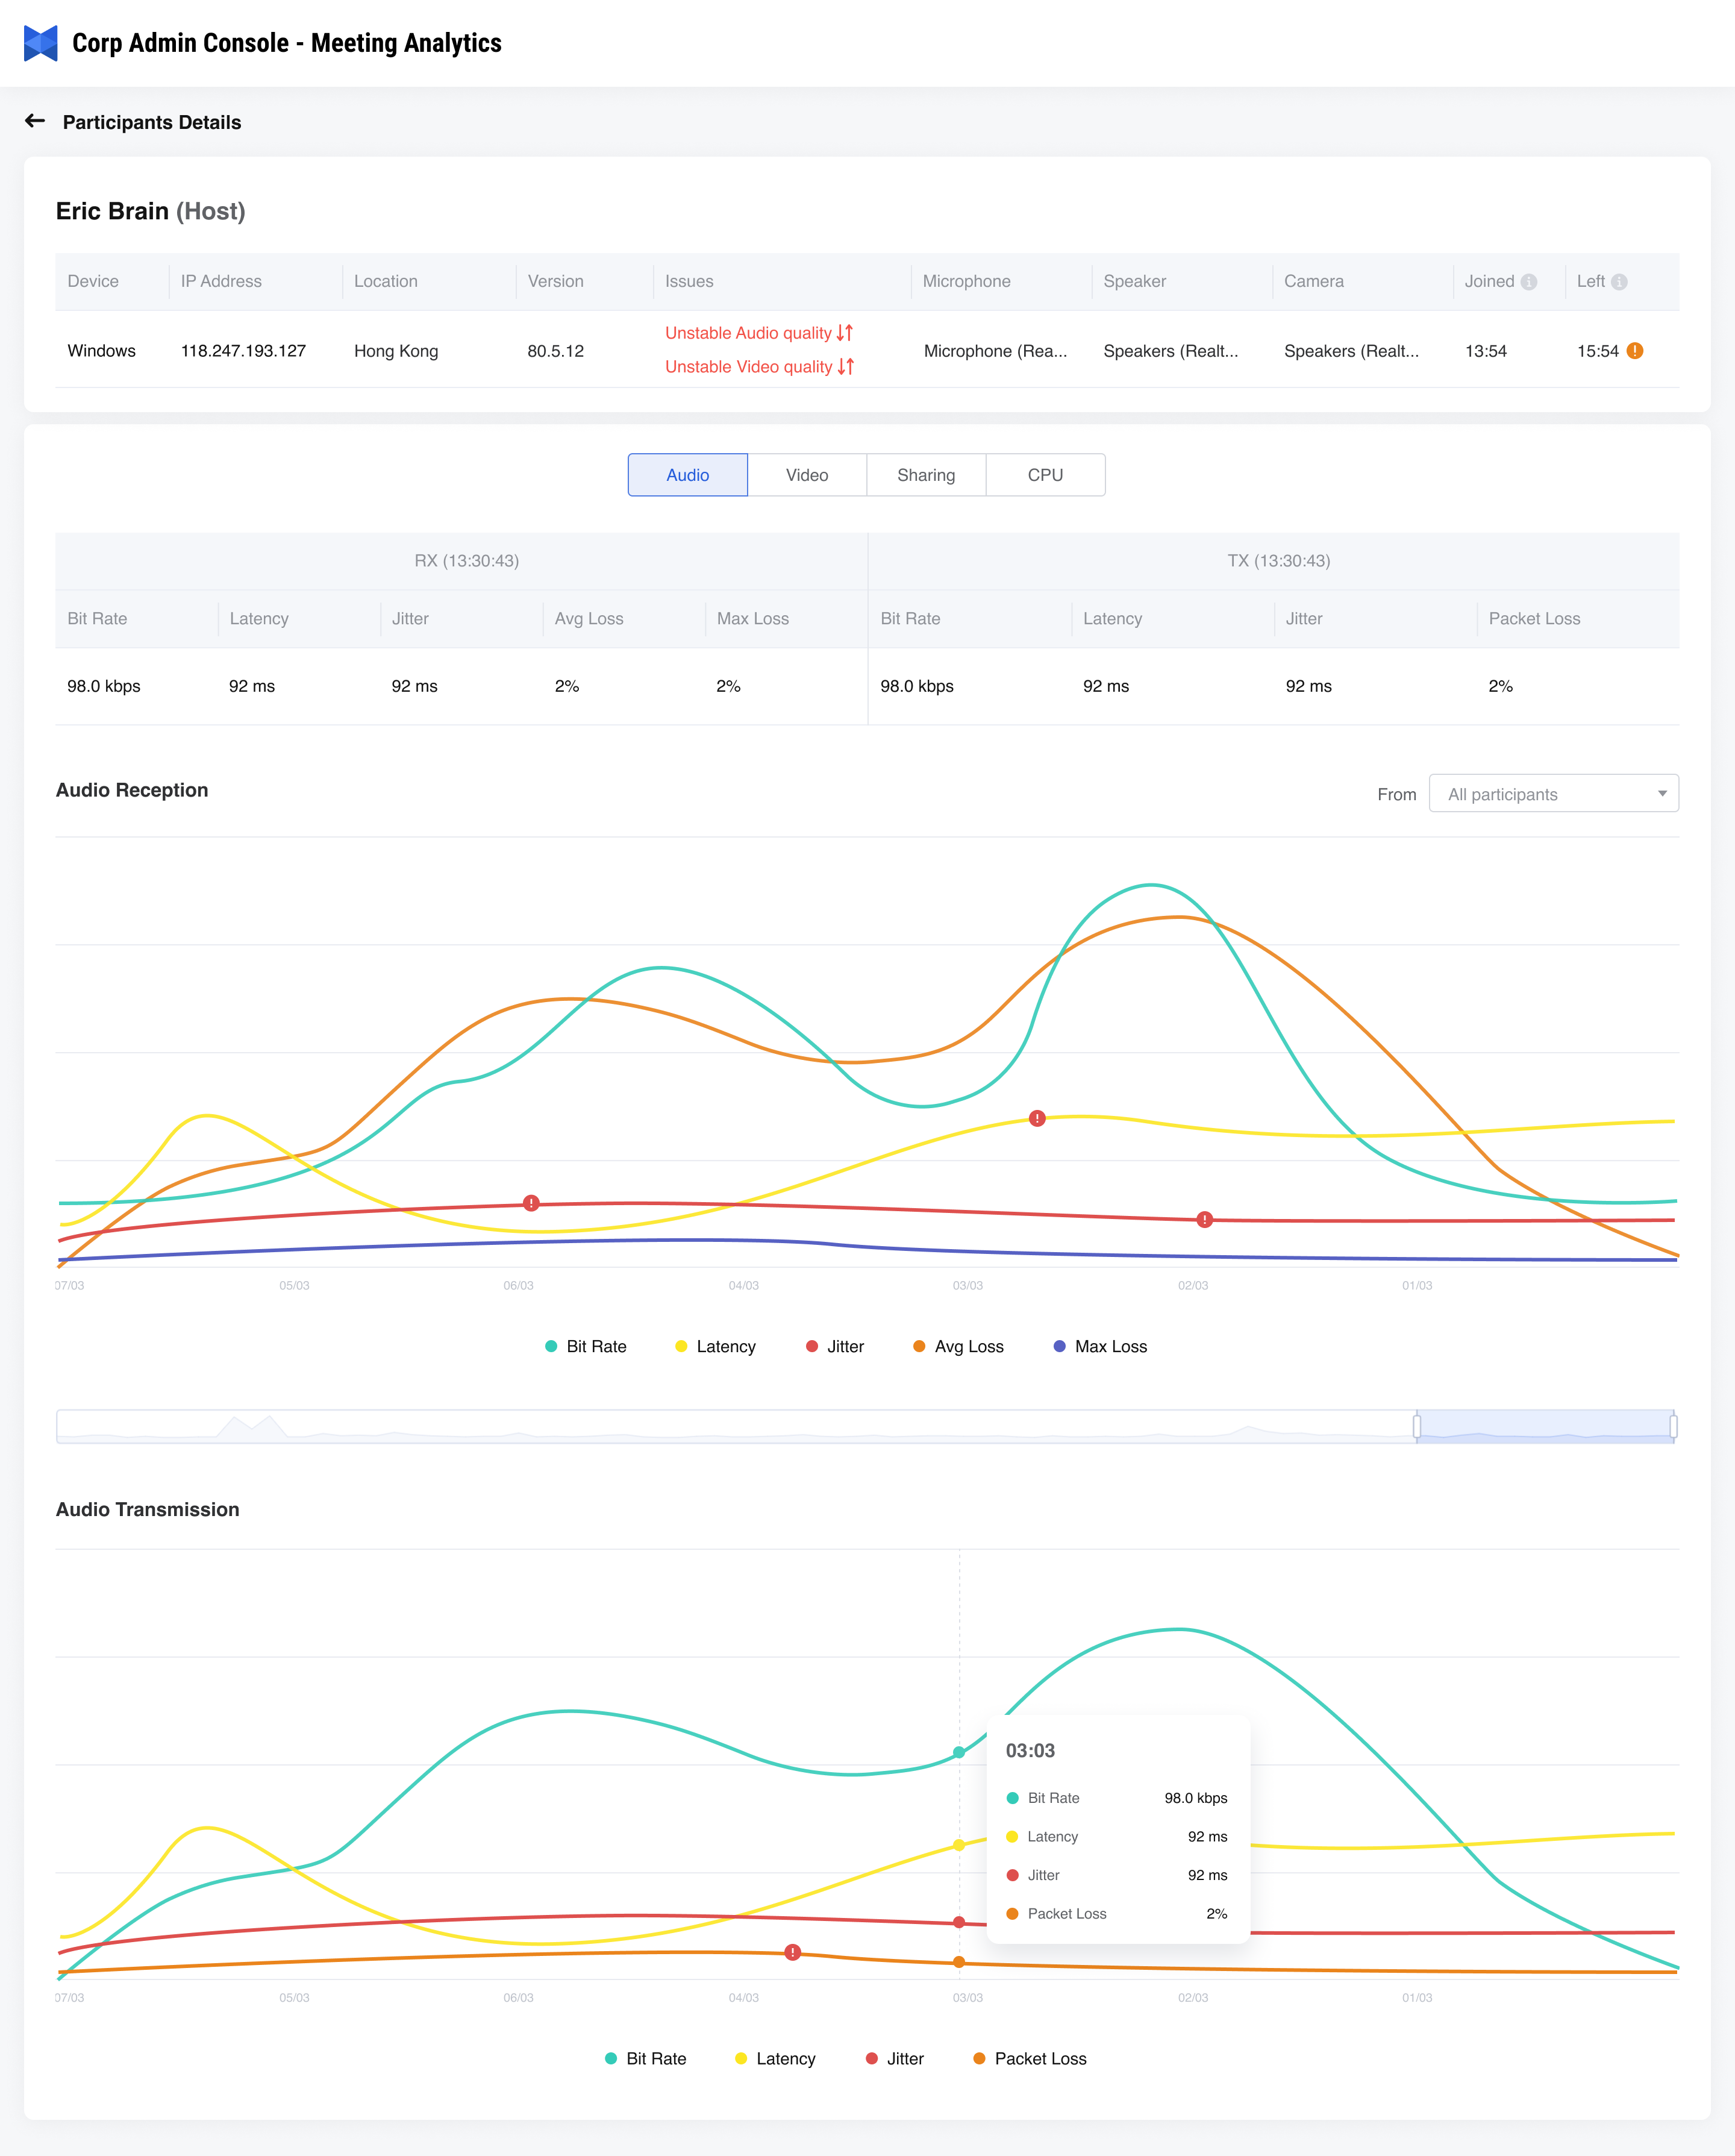
Besides the participant details on the list, you can click the participant's name to see the detail page of the relevant participant. On the detail page, you can see the line graph of the participant's audio, video, shared content, and CPU. The data in these graphs contain:
- Bit Rate: indicates the total bits that transmit per second.
- Delay: The delay between a packet being sent and received. Higher latency values will result in noticeable delays between video and audio. For example, the time between you speaking and the other user receiving the audio on their end.
- Jitter: The variation in the time between packets arriving, caused by network congestion, timing drift, or route changes.
- Package Loss: The amount of data that fails to reach the final destination.
- Resolution: refers to the total number of counts of pixels in one frame.
- Frame Rate: indicates the total frame numbers that display per second.
- CPU Usage: refers to CPU resources occupied by running programs or the system. The higher the CPU usage is, the busier the system or the client is.
The image below is the line graph of a participant's video quality. You can hover to see more details of a participant at one moment.
Join as Assistant
In the Meeting Analytics part, from a meeting detail page, click the "Join as assistant", you will be transferred to the Meeting Control page. On that page, you can take full control of the meeting as an assistant instead of actually joining the meeting.